
Tracking and analyzing your trades is the secret sauce behind every successful trader’s edge. If you’re trading perpetual contracts on Hyperliquid, you already know speed and transparency are non-negotiable. But how do you actually track Hyperliquid trades and turn raw data into actionable insights? Enter Hyper Dash - a specialized analytics dashboard that brings clarity to your performance, helps you spot trends, and even lets you follow the best (and worst) traders in real time.
Why Real-Time Analytics Matter for Perpetual DEX Traders
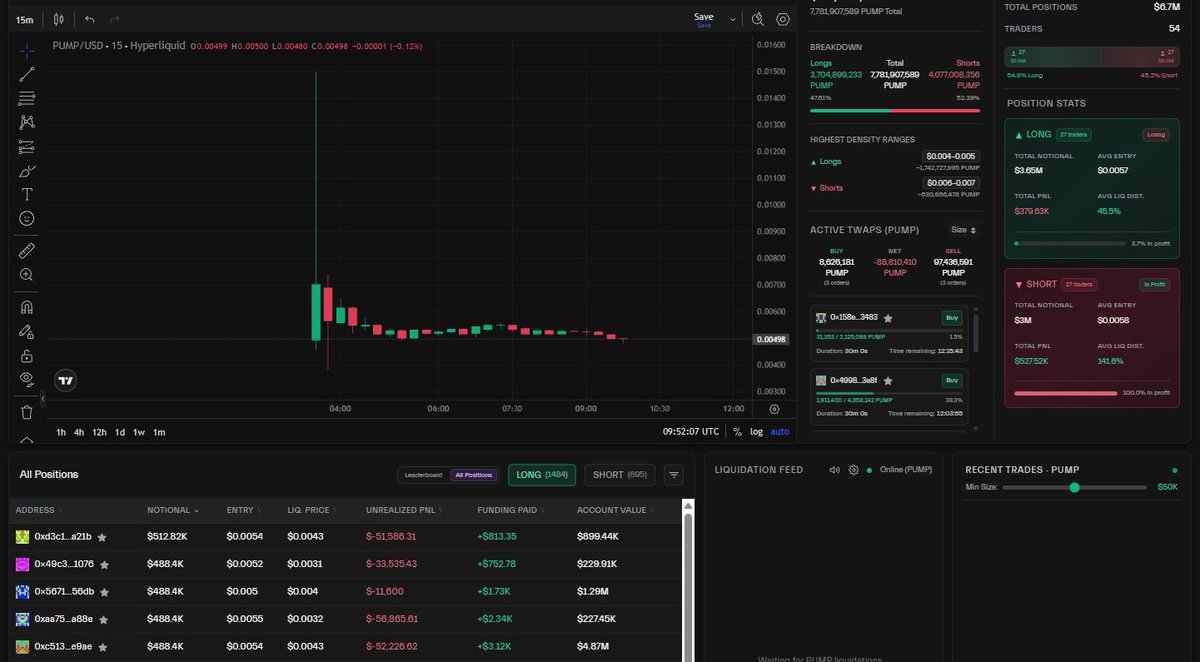
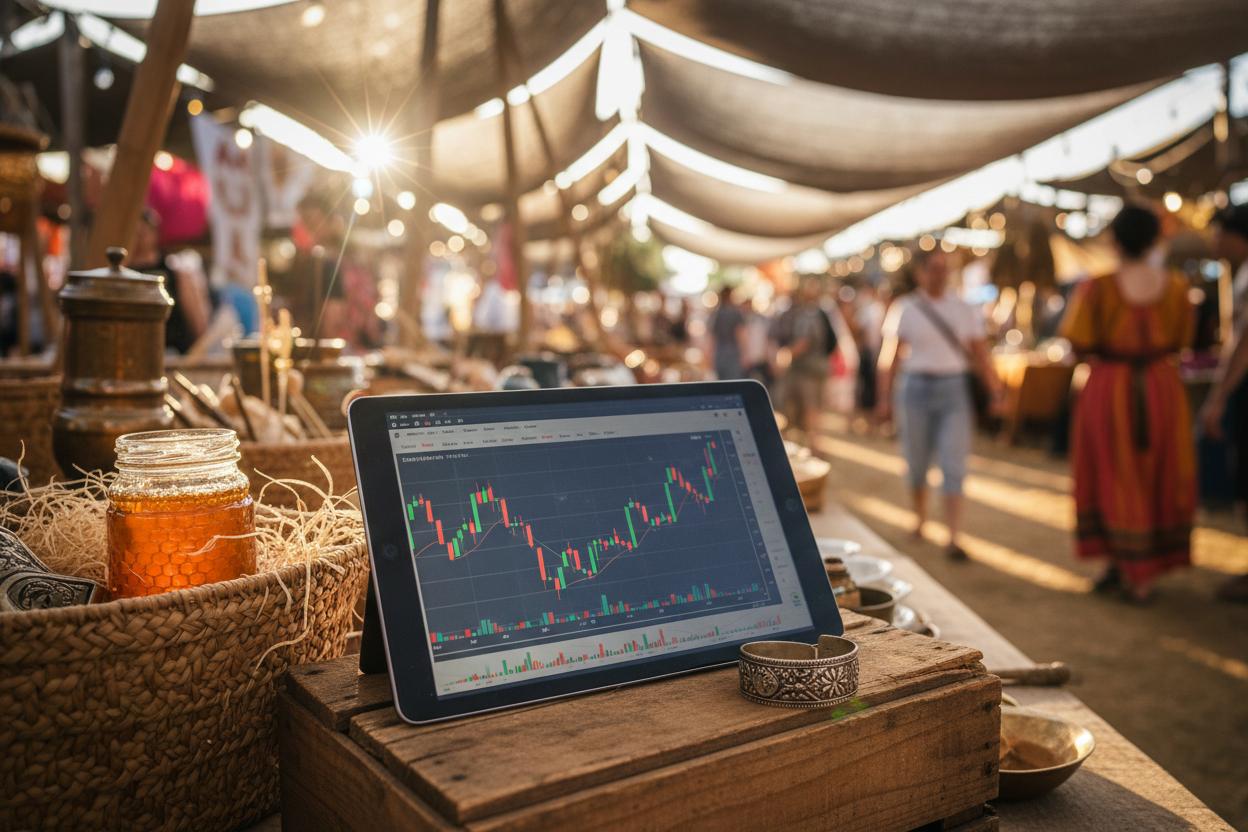
Let’s face it: the decentralized perp market moves fast. With Hyperliquid commanding $13.5 billion in open interest, compared to Aster’s $3 billion, every second counts. That’s where Hyper Dash trading analytics comes in handy. Instead of sifting through endless wallet transactions or clunky spreadsheets, Hyper Dash provides an at-a-glance view of your open positions, PnL swings, and risk metrics - all in real time.
This isn’t just about vanity metrics or leaderboard chasing. It’s about making smarter decisions based on live market context. With competitors like Aster gaining ground, knowing exactly where you stand - and how top traders are adapting - can be the difference between riding a trend or getting left behind.
Getting Started: Connecting Your Wallet to Hyper Dash
Setting up Hyper Dash is refreshingly simple for DeFi users:
- Connect your wallet: Visit the official Hyper Dash dashboard and link your wallet address securely.
- Instant trade history: Once connected, your entire trading history on Hyperliquid populates automatically - no manual uploads needed.
- Dive into analytics: From here, explore detailed charts showing PnL by trade, leverage usage over time, average position sizes, and more.
If you want to analyze another trader (or whale), simply enter their wallet address to unlock their public trading stats. This transparency is unique to decentralized exchanges like Hyperliquid and opens up powerful ways to learn from others’ strategies.
Diving Deeper: What Can You Track with Hyper Dash?
The real magic of using perpetual DEX analytics tools like Hyper Dash lies in the granularity of insights available. Here are some of the key features that make it indispensable for both beginners and advanced traders:
- P and L breakdowns: Visualize realized vs unrealized profits across all your trades.
- Leverage monitoring: See how aggressive (or conservative) your strategy has been over time.
- Leaderboard and Whale Tracking: Instantly spot who’s crushing it - or blowing up - by scanning top trader stats on the public leaderboard. Curious what makes a top performer tick? Analyze their open interest shifts and risk management habits directly from their profile.
- Error spotting and improvement tracking: Identify common mistakes (like over-leveraging or holding losers too long) so you can course-correct before they snowball.
If you’re curious about real-world applications of these features, check out this video walkthrough showing how savvy traders use dashboards to spot alpha opportunities on-chain:
The beauty here is that everything updates live as markets move - no more waiting for delayed reports or missing out on fast-moving trends.
As you explore Hyper Dash, you’ll quickly realize how much more confident your trading becomes when you have the right data at your fingertips. For example, say you’re tracking a whale who’s consistently outperforming the market. With just a few clicks, you can dissect their position sizing, entry/exit timing, and even their risk allocation during volatile swings. This transparency is what sets Hyperliquid-Style Perps performance tracking apart from traditional centralized exchanges.
Using Leaderboards and Whale Tracking to Level Up
The public leaderboard feature isn’t just for bragging rights, it’s a goldmine for pattern recognition. By observing how top traders adjust leverage or pivot strategies as open interest on Hyperliquid hovers at $13.5 billion, you gain an edge in anticipating market shifts. Likewise, whale tracking lets you spot sudden changes in position sizes or asset allocations, which often signal upcoming volatility or trend reversals.
Essential Metrics to Track on Hyper Dash
- PnL (Profit and Loss): Monitor your PnL in real time on Hyper Dash to see exactly how much you’re making or losing on each trade. This helps you spot winning strategies and areas for improvement.
- Leverage Ratio: Keep an eye on your leverage ratio to manage risk. Hyper Dash displays your current leverage, helping you avoid overexposure and potential liquidation on Hyperliquid.
- Win Rate: Track your win rate—the percentage of profitable trades. Hyper Dash calculates this automatically, so you can measure your consistency and adjust your trading approach.
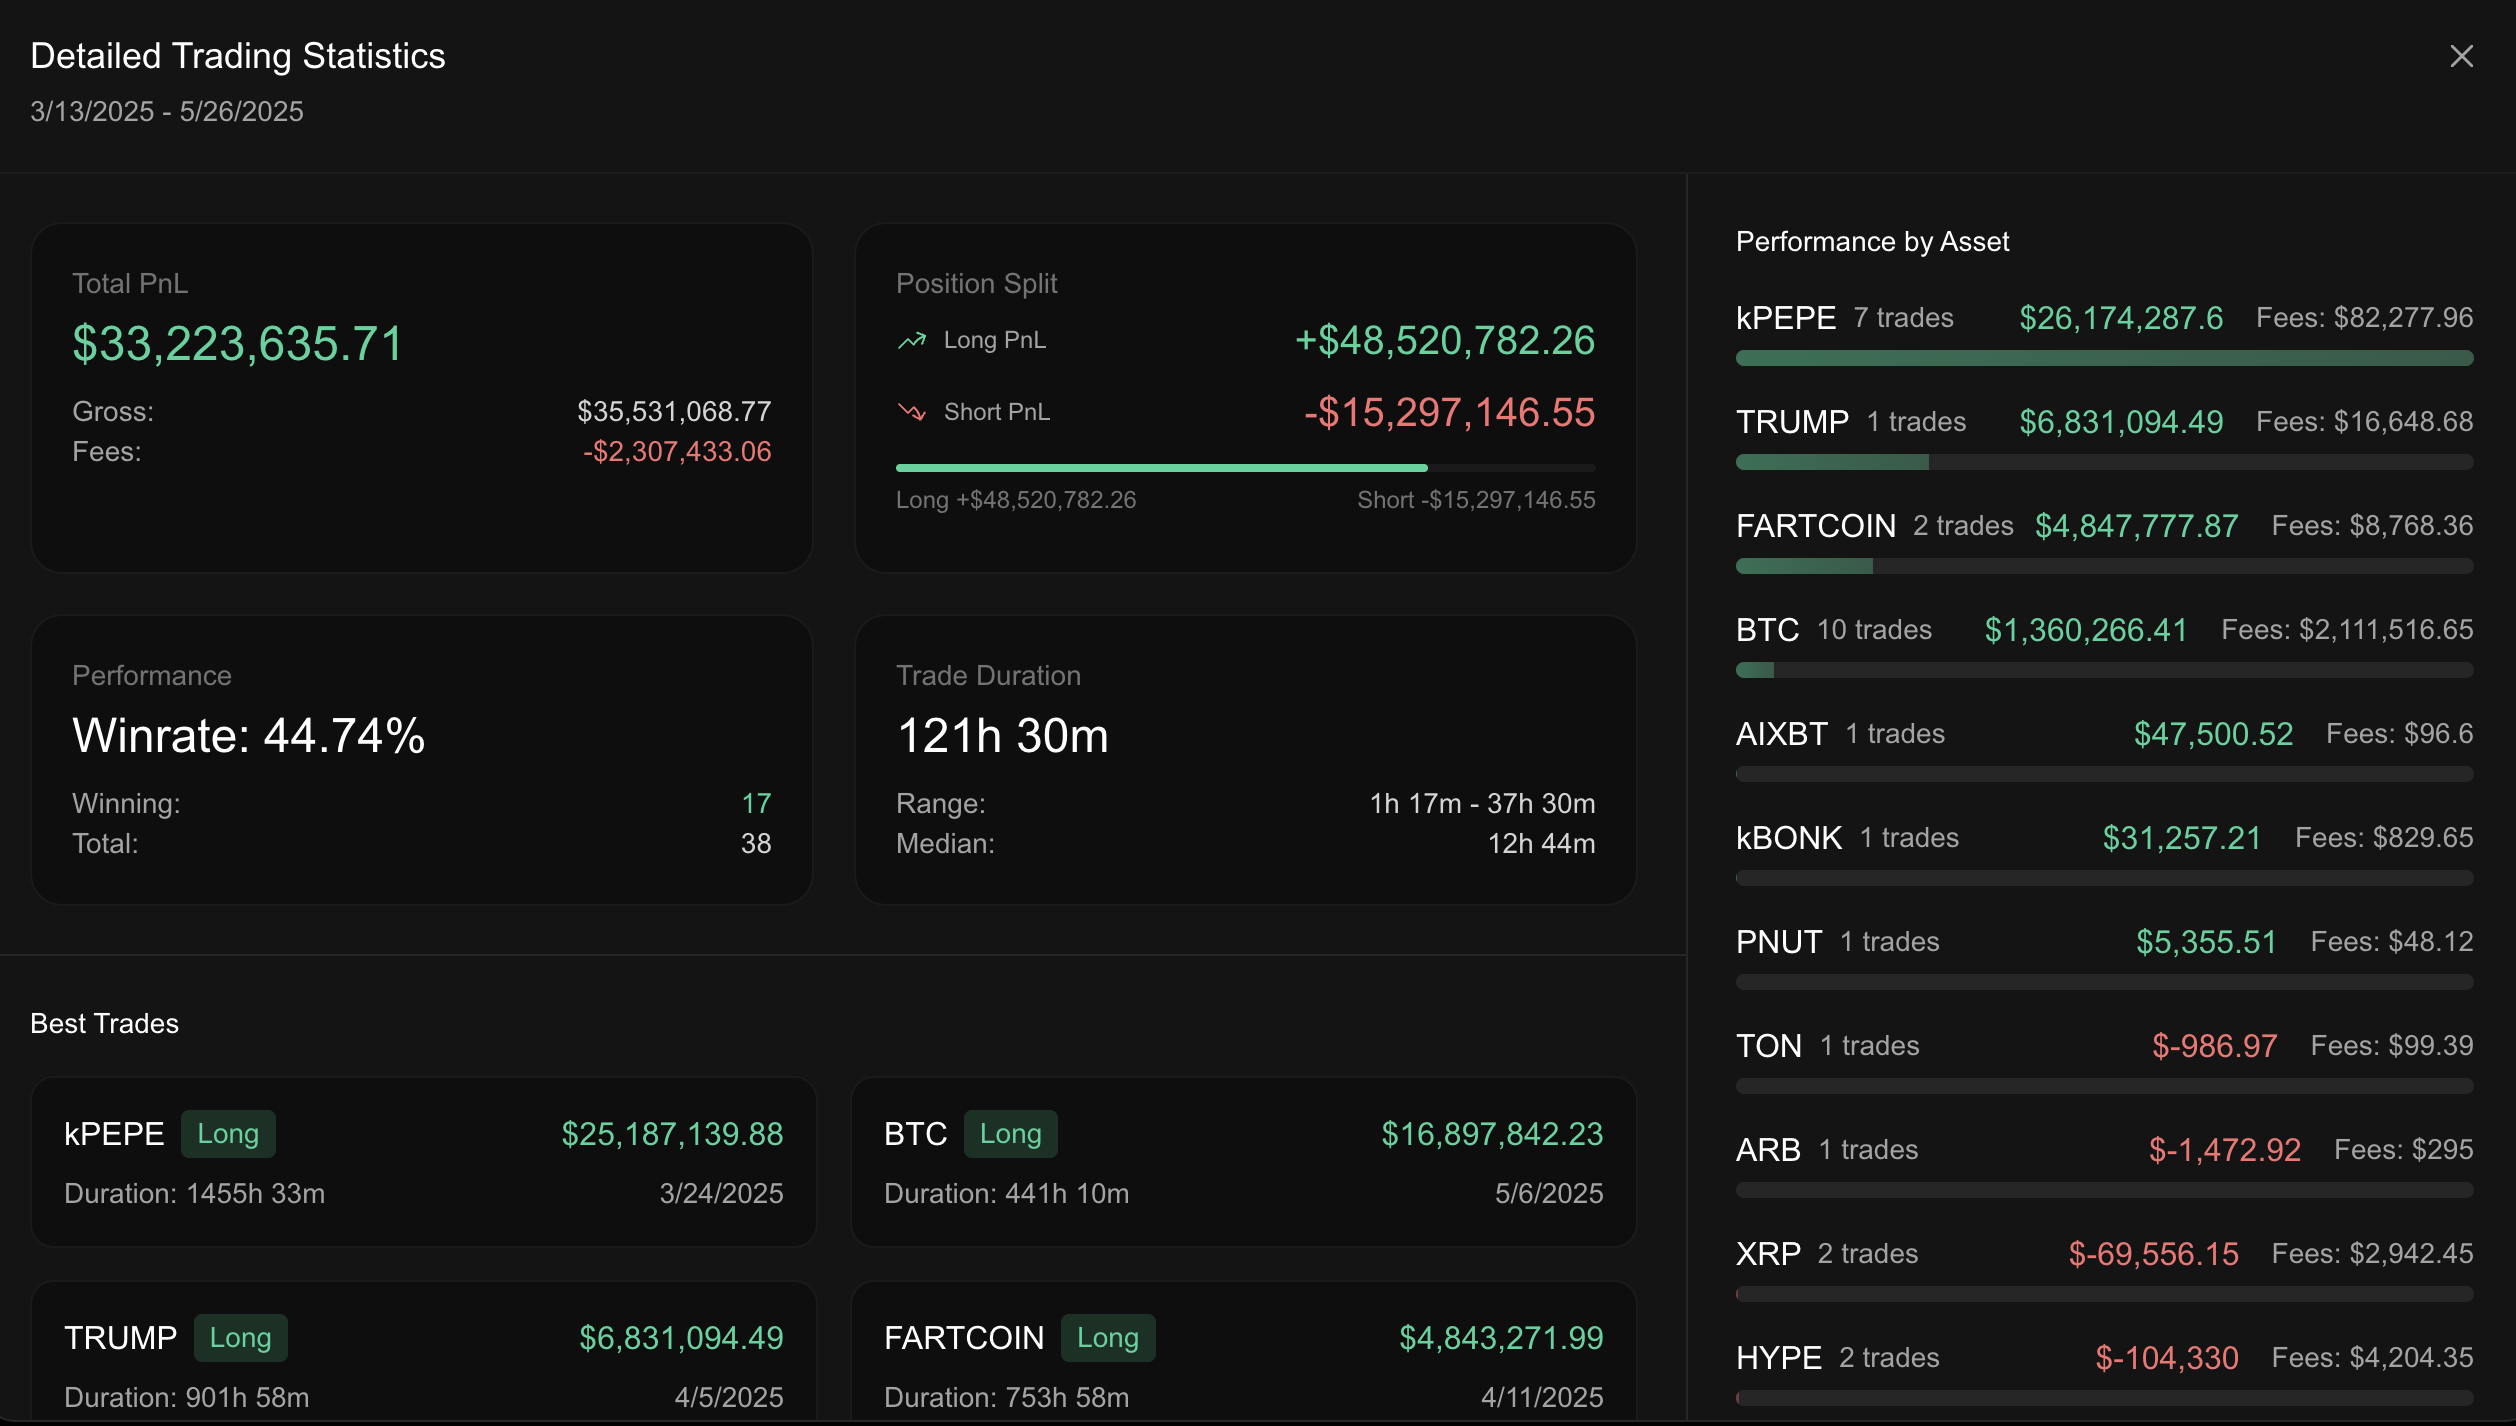
- Drawdown: Analyze your drawdown to understand the largest peak-to-trough loss in your trading history. Hyper Dash visualizes this, making it easier to spot risky patterns and protect your capital.
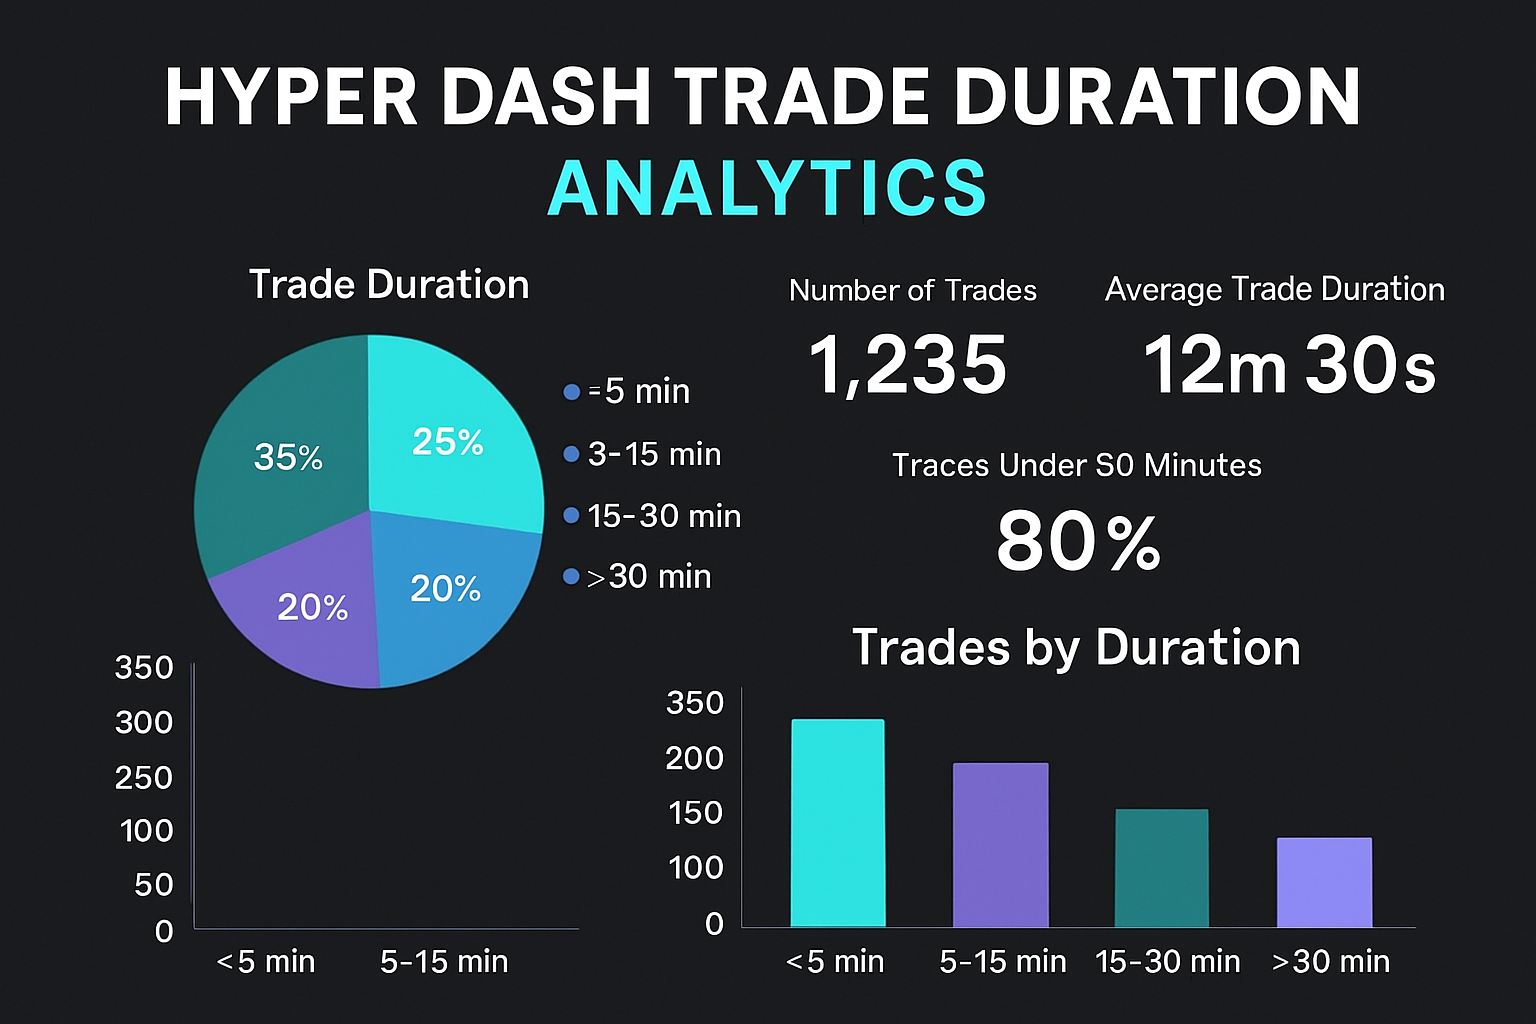
- Trade Duration: Review the average trade duration to see how long you typically hold positions. Hyper Dash breaks this down, helping you refine your entries and exits for better timing.
If you’re new to this level of analytics, start simple: monitor your win rate and average PnL per trade over the last week. Then gradually layer in more advanced stats like drawdown analysis and trade duration to uncover hidden strengths (or weaknesses) in your approach.
Real-Time Alerts and Portfolio Health Monitoring
One of the underrated benefits of Hyper Dash is its ability to send real-time alerts for key events, think liquidation risks, margin calls, or sudden drops in portfolio value. This is especially crucial when trading on a platform where open interest dwarfs competitors (with Hyperliquid’s $13.5 billion vs. Aster’s $3 billion). Fast notifications mean you can react instantly rather than catching up after the fact.
For those managing multiple positions across different perpetual pairs, Hyper Dash’s dashboard view makes it easy to see your overall exposure and risk at a glance. Color-coded indicators flag positions that need attention so nothing slips through the cracks.
Tips for Getting the Most Out of Perpetual DEX Analytics
- Set benchmarks: Compare your stats against top traders on the leaderboard each week.
- Review mistakes: Use error spotting features to identify recurring issues like overtrading or poor stop placement.
- Stay adaptive: Markets evolve quickly, regularly update your strategy based on new insights from whale movements and leaderboard trends.
- Don’t ignore small losses: Granular analytics can help you spot slow leaks in performance before they become big setbacks.
The decentralized futures landscape is always shifting, but with tools like Hyper Dash, you’re not just reacting to market noise; you’re proactively steering your trading journey with data-driven confidence. Whether you're chasing alpha by shadowing whales or simply looking to refine your personal performance metrics, real-time dashboards are now an essential part of every serious trader's toolkit.

No comments yet. Be the first to share your thoughts!